Monday, April 27, 2009

Star Plots


This star plot above was designed by NASA and is labeled MER IDD. The center represents the most desirable results, and the red line represents the handcrafted MER IDD, which is used for comparison and validation of the star plot.

Correlation Matrix


The image shown above is a calculated protein correlation matrix for phage T7. Correlated behavior ranges from high (red) to low (blue), and the triangular block of red reflects proteins involved in phage assembly, which is a highly coordinated process.

Similarity Matrix


The image above is an example of a Similarity plot graph. This specific graph shows similarities between variables and it shows the corelation between data. The similiar the data the greater the correlation and the higher the values the greater correlation beween the data sets.

Stem & Leaf Plot

This Stem & Leaf plot shows in the left column test scores 6 through 10, as 60% through 100%.  In the right column, the number correlates to the total numbers' percentage, and how many how that number there are, for example as shown: 7|2 = 72%. 

Box Plot


This box plot shows the tip of both whiskers on each box represent the maximum value and the minimum value, and the box part represents the value of 1/4, 1/2, 3/4, and median value. 

Histogram

This Histogram represents for a company a specific number of employees on the y-axis, and their yearly salaries on the x-axis. A Histogram graph illustrates information in graph form much like a bar graph. 


Parallel Coordinate Graph

This parallel coordinate graph is used to express the relationships between several variables across the X and Y axis. Each variable is shown as a different shade of color.

Triangular Plot

This triangular plot graph is intended to show the differences and similarities of the Democratic and Republican political parties. The two bottom points 3 & 4 identifies each party, however,  the peak of the triangle represented the bipartisan efforts of each party.

Windrose


This a windrose image is of a 30-year summary from the Louisville Airport that displays a compass style chart showing the wind direction, and a color scale measuring the windspeed in knots.  

Climograph

The specific climograph above shows precipitation measured in inches, and temperatures measured in fahrenheit, for the state of Arizona. These measurements have been taken from long term averages from 1971-2000. 

Population Profile


The population profile graph above illustrates the 1998 population for Mobile County. The age class is divided into increments of 4 years, and is on the y-axis. On the x-axis are percentages of each age class to the total population. Males and females appear on two separate columns, and in color variation. 

Scatterplot

The image above is an example of a scatterplot graph. This graph represents the area of trees harvested by sq km, and the number of trees replenished in Canada for 2001. A scatterplot is a comparison graph of data or variables on a X and Y axis, with scattered points showing the progress of the graph. 

Index Value Plot


This index value plot graph shows the average streamflow index since January 16, 2001, for New Mexico. This map shows the conditions of the state for the past few years whether they were normal, wet, or dry. 

Lorenz Curve


The Lorenz curve shown above is a graph that represents income distribution by comparing the cumulative percentage of income on the y-axis, and the cumulative percent of households on the x-axis. According to the graph the green line is the line of perfect equality, the red line is the Lorenz curve, and the blue line is the line of inequality.

Bilateral Graph


Bilateral graphs compare two or more sets of data in a visual graph. This bilateral graph represents the demographics of pedestrian casualties in Calgary and all pedestrian casualties in Edmonton, compared to the province wide data for all traffic casualties.   

Nominal Area Choropleth Maps


This nominal area choropleth map is of Australia, illustrating only by color the different climate regions across the country. This map only shows nominal data of what type of climate there is spread out over each province. 

Unstandardized Choropleth Maps


This is an unstandardized choropleth map relating to the United States Presidential election from 2008. The data shown in the map above does not list any specific scales, numerical values or averages for each state; there is only a variation of color for Republicans as red, and Democrats as blue, and a mixed color for states of mixed votes. 

Standardized Choropleth Maps

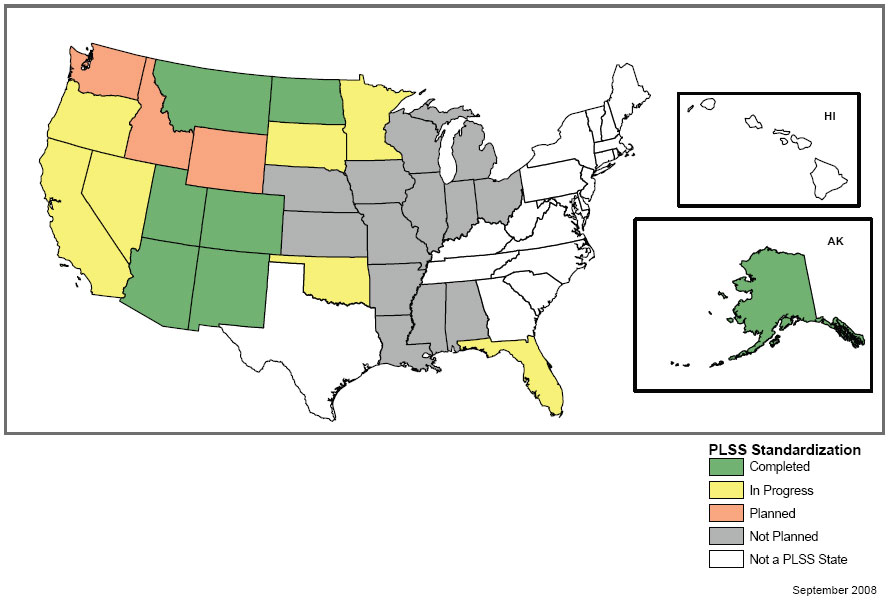
This standardized choropleth map shows the population density for the United States and Puerto Rico from July 1, 2004, according to the U.S. Census Bureau. This is standardized information in colored intervals of the average population per square mile for each state. 

Univariate Choropleth Maps


The Univariate Choropleth map above shows only one part of data with five color variation intervals of farm acreage of each state in accordance to the rest of the United States.

Bivariate Choropleth Maps


This bivariate choropleth map of the Mid-Atlantic coast displays two variables on one map, the people per square mile, and the percent change in population 1990-2000, as well as by combining two different sets of colors.

Unclassed Choropleth Maps


Unclassed choropleth maps portray much of the same data from classed choropleth maps although the scale intervals of variation are in greyscale. The map above shows the percentage of persons who are white by state, for the year 2000.

Sunday, April 26, 2009

Classed Choropleth Maps


This classed choropleth map shows the estimated population density of Nebraska in 2011, as shown in the five intervals of color variation from yellow to dark orange, for the persons per square mile between counties across the state. 

Range Graded Proportional Circle Maps


Here is a Range Graded Proportional Circle Map from mobile cellphone company TEXXASTAR Wireless. This map shows the general wireless coverage for the area. The map is labeled with color coded range graded proportional circles to indicate where there is service from cell phone towers (green circles), new construction of towers in 3-12 months (blue circles), and planned future service in the next 12-24 months (red circles).    

Continuously Variable Proportional Circle Maps


Here is a Continuously Variable Proportional Circle Map showing the Zn and Pb in the surface waters of the Bathurst Mining Camp in New Brunswick, Canada. The largest deposits are in the areas Restigouch (labeled "R"), and Murray Brook ("MB"). Continuously variable proportional circles are used to show amounts of tested data in the image.

DOQQ


Digital Orthoquarter Quads (DOQQ), are geo-rectified raster images that are developed from aerial photography. DOQQ images can be produced as false color infrared photos, or in true color. False imagery helps delineate surface features, as exemplified in the photo above from Lago Vista, Texas.

DEM


A Digital Elevation Model (DEM), is a geographic representation model showing 3D raised relief. DEM models are created by the use of remote sensing techniques. The DEM image is from a portion of a Canadian mountain range.

DLG


A Digital Line Graph (DLG) are digital vector representations of cartographic information. This image of the United States shows state and county boundaries. 

DRG


A Digital Raster Graphic (DRG), is a scanned image of a USGS topographic map. The map  is georeferenced to the surface of the earth and fit to the Universal Transverse Mercator projection, and is scanned at a minimum resolution of 250 dots per inch. 

Thursday, April 23, 2009

Isopleth


This isopleth map shows the hydrogen ion concentration as PH in 1999. The variation in the color scale of the lab PH levels shows higher concentration of PH levels on the east coast in opposed to the rest of the continental United States where it is about at equal level throughout. 

Isopach


Isopach maps show the relief of the oceans, and other bodies of water to determine the formations and the depths of them. The isopach map of the lower New York continental shelf show lines that connect areas of thickness in meters of the quaternary sedimentary deposit. 

Isohyets


Isohyet are the lines on a map that show equal rainfall precipitation levels. This map represents the rainfall measured inches for eastern Larimer County, Colorado, from July 2007.  

Isotachs


Isotachs measure wind speeds. This isotach image from February 2nd, 1998, shows wind speeds for the eastern United States.


Isobars

Isobaric maps show lines of barometric pressure. On a map showing the distribution of high and low isobaric pressure, and  the more closely the lines are together, the stronger the pressure and the wind speed. The image above is a forecasted isobaric map of Europe for Friday, April 24th, 2009. 

LIDAR


LIDAR stands for light detection and ranging. LIDAR is used to determine the distance to a surface plane or object using laser pulses to measure the time delay between the pulse and its reflected signal. The result is used to create 3D models like the one pictured above. 

Wednesday, April 22, 2009

Doppler Radar


This doppler radar image from June 28, 2007, at 3:54 p.m. indicates a severe thunderstorm watch for New York, New York. The doppler image shows strong storms with varying intensity. 

Black & White Aerial Photo

This black and white aerial photograph was taken in 1948, and is of Florida State University and the surrounding Tallahassee area. 

Infrared Aerial Photo


This infrared image is an aerial view at a scale of 1:12000. This aerial image is an evaluation of the land use. The right hand corner shows boundaries of crop fields which are shown in red; the darker red indicating denser vegetation. The left side shows undeveloped barren land with a canal through this parcel of land. The bottom right shows a lake.  

Cartographic Animations

A cartographic animation map shows movement over time and space. This video clip shows a dot density animation of the expansion of Wal-Mart stores from 1962-2004 in the United States. 

Statistical Maps


Statistical Maps are those that convey statistical information regarding geographical locations. This map illustrates the hurricane coastal strike probability for the state of Florida. These hurricane strike probabilities are statistical estimates.  

Cartograms


Cartograms are maps that show a geographic area that is distorted. This cartogram represents the electoral votes from the 2004 election. 

Flow Maps


Flow maps are are used to show movement through lines. This map shows the corridor flow of drug trafficking  from the source zone of South America, to the transit zone of the Caribbean (40%) & Mexico (60%), and finally to the arrival zone of the United States.

Isoline Maps


This isoline map depicts the geographic area of the United States average annual temperatures of summer and winter from 1961-1990. Isoline maps show varying lines of equal values across a surface.  

Tuesday, April 21, 2009

Proportional Circle Maps

This proportional circle map indicates information regarding population levels of the cities surrounding the Great Lakes (Lake Michigan & Lake Huron), in a set of circle sizes for urbanized and rural areas. 

Choropleth Maps


This choropleth map from the 2000 United States Census shows the percent of people in the state of Florida, in accordance to county, who are of Hispanic or Latino race.  

Dot Distribution Maps


This dot distribution map shows the total township population distribution for the state of Ohio, in the year 2000. Each dot on the map represents 100 people, and the grey shaded areas represents areas of urban populations.

Propaganda Maps


Propaganda maps are designed and directed to influence a specific group of viewers by conveying information that may or may not be truthful. 

This advertisement from Absolute Vodka that was promoted in Mexico is a propaganda map depicting the Southwestern section of the United States as part of Mexico. This map illustrates a message of a historical reference to how the boundary was at one time between both countries before the 1848 Mexican-American War, Or this could relate a message of the population density of Mexicans residing the United States. However  way you look at this image, it is propaganda.   

Hypsometric Maps


A Hypsometric map is a surface map the shows topographic relief in the 3rd dimension by contour lines, raised relief, color or shading. This hypsometric map of New Mexico that illustrates the elevations levels from sea level to 10,000 ft,  by raised relief and color. 

PLSS Maps


The United States Public Land Survey System is a systematic land partitioning system that covers U.S. States excluding the states on the east coast corridor, Texas, and Hawaii. Areas outside the United States PLSS system are said to be "unsystematic."

Cadastral Map


Cadastral maps are maps that illustrate precise boundaries and dimensions of locational areas, as well as facilitates ownership. This type of map specifically shows an aerial view identifying street names and numbers, geographical features, and the property values of the homes and land.

The link below is to the website www.zillow.com, which is a source of information for homeowners and those who are in the market to purchase a home. This link will direct you to an satellite aerial map of the zip code 33480, in Palm Beach, Florida.  This cadastral map shows the geographic features of Palm Beach Island, including roads and bridges, Everglades golf course, the Florida Intracoastal waterway, boundaries of property, and the estimated home values ranging from $6.56 million, to $33.7 million dollars. 


Sunday, April 19, 2009

Thematic Map


This thematic map illustrates the breakdown of the land reserves on the island of Hawaii, including the ownership of the land and its function.  

Topographic Map


This topographic map was produced by the United States Geological Survey and illustrates the community of Northeast, Maryland which is located along the shoreline of Chesapeake Bay. A topographic map is a type of contour map that shows terrestrial elevation through contour lines that portray relief, as well as the shape and of the land. 
Topographic maps identify features such as highways, roads, railways, buildings, political boundaries, and specific land types. 

Saturday, April 18, 2009

Planimetric Map


This Planimetric map is a map showing only the horizontal position of features on the Earth's surface, which show geographic objects, natural and cultural physical features, and entities without topographic features such as roads, buildings, and water bodies that are visible and identifiable on aerial photographs. The map above is a Planimetric map that is used for the preliminary design of a transportation project.

http://www.ncdot.org/doh/PRECONSTRUCT/highway/photo/Products/images/Planimetric_map.jpg